Demo
The demo runs the seven steps of SPEC "Demo script" against the live compose stack:
make demo. One orchestrator (demo/run_demo.py) plays every scene in order. It prints a
narrated transcript showing who acts, what is sent, what the gateway decided with its
reason_code, and the matching audit entry. It also checks each outcome: if any scene
deviates, the run exits 1, so make demo doubles as an end-to-end check.
- Agent actions run inside the
agentcontainer. That container sits on theedgenetwork only. Each action is onedocker compose exec -T -e ACL_TOKEN agent python -m acl_agent ...call.demo/agent/acl_agent/is DataBot, a small httpx client that speaks MCP (streamable HTTP on/mcp/{server}) and OpenAI chat (/v1/chat/completions) tohttp://gateway:8080and to nothing else. The bearer token arrives through the environment, never the command line. - Operator actions run on the host. These are demo tokens, approvals, policy edits,
EXPLAINand audit reads. They go to the operator API on127.0.0.1:${ACL_OPERATOR_HOST_PORT}and throughdocker compose execinto the gateway (audit JSONL) and Postgres.
A full run takes 1.5 to 4 minutes. Scene 5 is the only one that waits for the CPU model. Measured timings are in Recorded run.
Prerequisites
cp .env.example .env                                  # replace every secret
docker compose --profile init run --rm ollama-init    # qwen3:8b into the ollama volume (~5 GB)
docker compose --profile init run --rm models-init    # injection classifier (~750 MB, pinned)
make demo-up                                          # stack + demo overlay, waits until healthy
If 9090, 8080 or 3300 is taken on your machine, set ACL_OPERATOR_HOST_PORT,
ACL_AGENT_HOST_PORT or ACL_GRAFANA_HOST_PORT in .env. make demo and run_demo.py read
the same values. Grafana's login is admin with ACL_GRAFANA_ADMIN_PASSWORD from .env.
Warm the model once before an audience sees it. The first LLM call after Ollama starts loads
5 GB of weights. Running make demo DEMO_ARGS="--scene 5" once is enough.
Running
make demo                                   # all seven scenes, exit 1 on any deviation
make demo DEMO_ARGS="--pause"               # wait for Enter between scenes (live talk)
make demo DEMO_ARGS="--scene 2 --scene 3"   # selected scenes
uv run python -m demo.run_demo --json reports/demo.json   # per-scene results as JSON
The run ends with a per-scene summary (status, seconds, checks) and Grafana links: the Threats dashboard and one Session trace link per interesting session (scene 2's tainted session, scene 3's autonomous one, and others).
Talk track
Each scene opens a fresh gateway session (a new token from the operator API). No scene inherits taint, risk or budget from another.
Scene 1: same agent, same question, different person (3 to 10 s)
Say: "Anna and Bartek ask DataBot the same question. The agent is the same, but the answer depends on who is asking. Bartek's agent is also refused a table Bartek can't read."
Audience sees:
- Terminal:
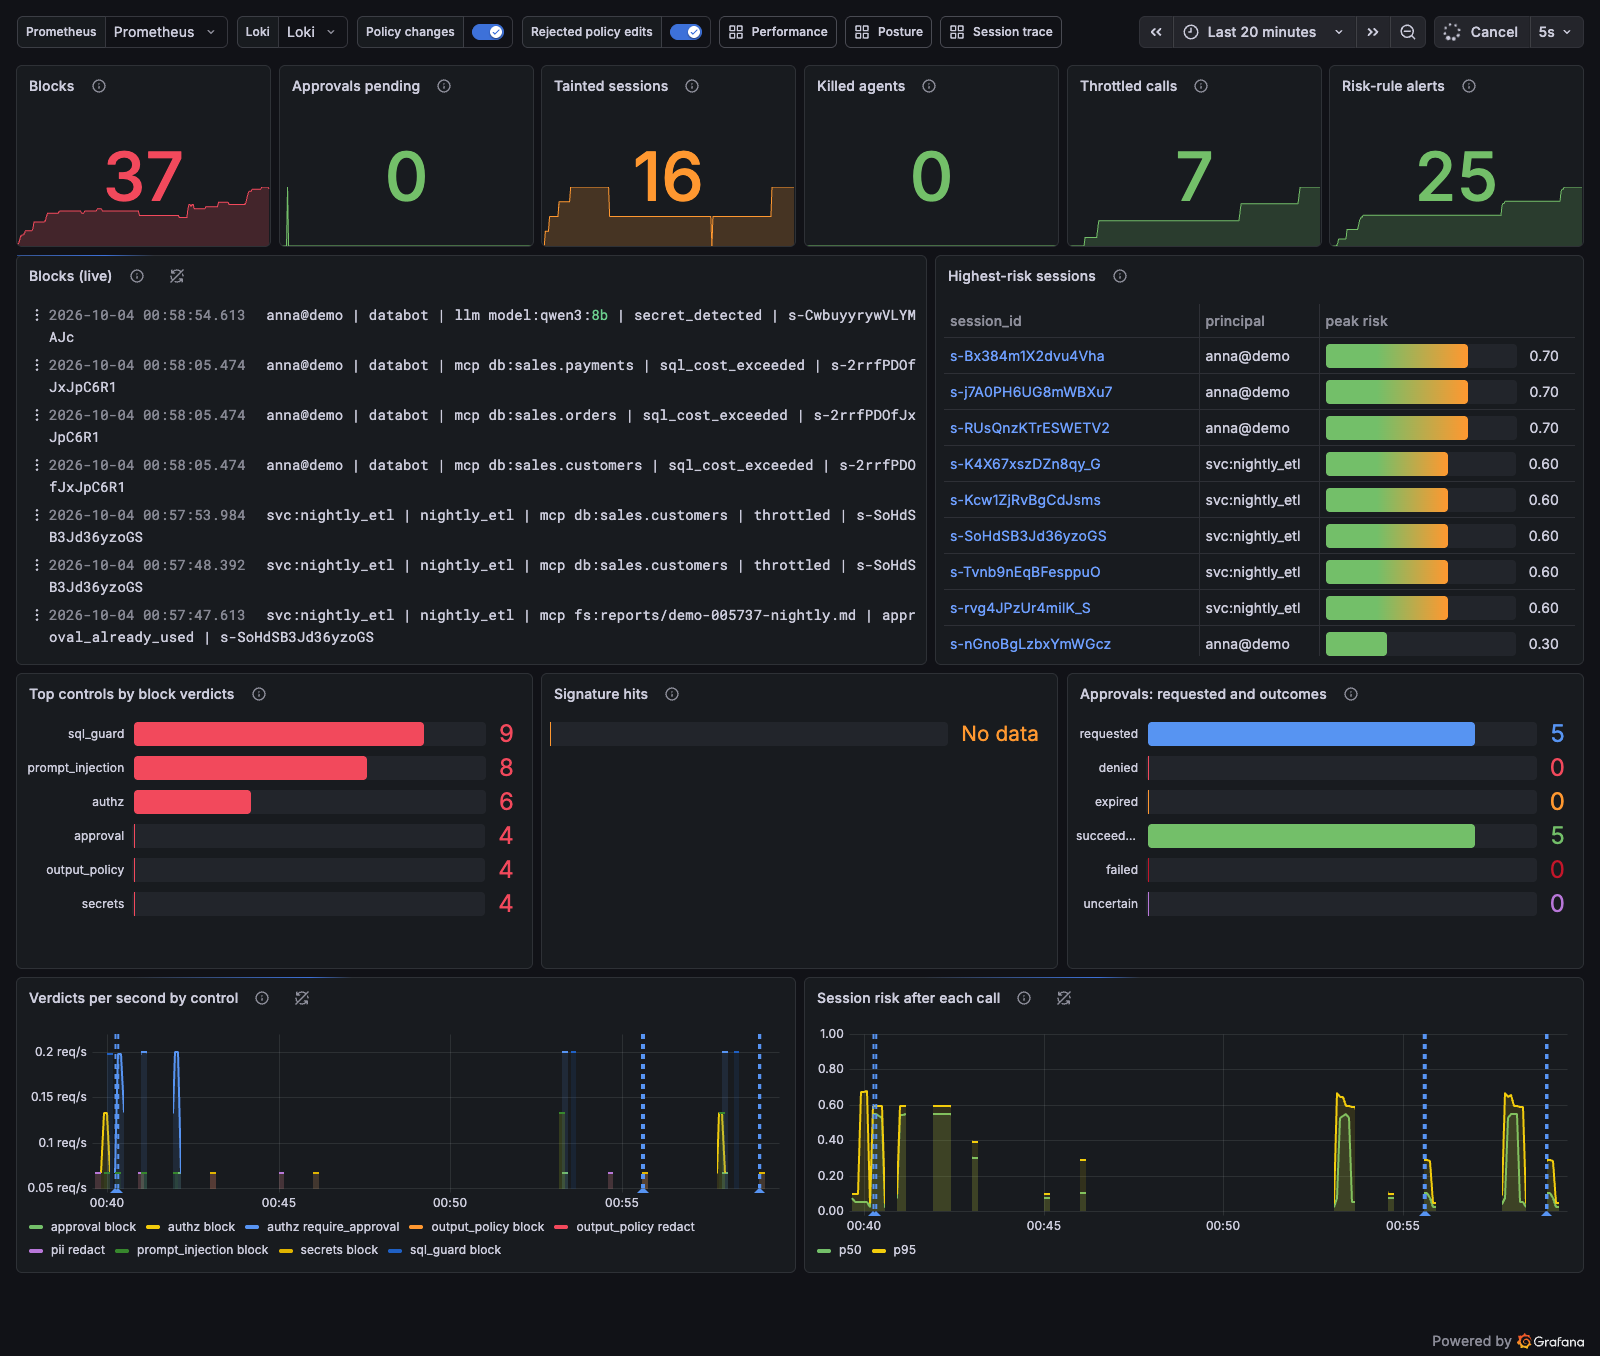
sales_db.query(SELECT COUNT(*) ...)returns 40 for anna and 7 for bartek. Bartek onsales.paymentsgetsoutside_principal_scope, and the audit line shows his effective scope, which has no payments. - Grafana Threats: the block appears in Blocks (live).
The gateway forwards the principal in a signed X-ACL-Principal assertion, and Postgres
row-level security filters the rows. The model never decides which rows a person sees.
Scene 2: indirect injection taints an interactive session (4 to 7 s)
Say: "DataBot may write reports, and it does. Then it reads a web page. The page hides an
instruction for AI assistants in a display:none block. The page is untrusted, so the session
is now tainted. The same write is refused for the rest of the session, and no human had to
notice anything."
Audience sees:
- Terminal: the first write is
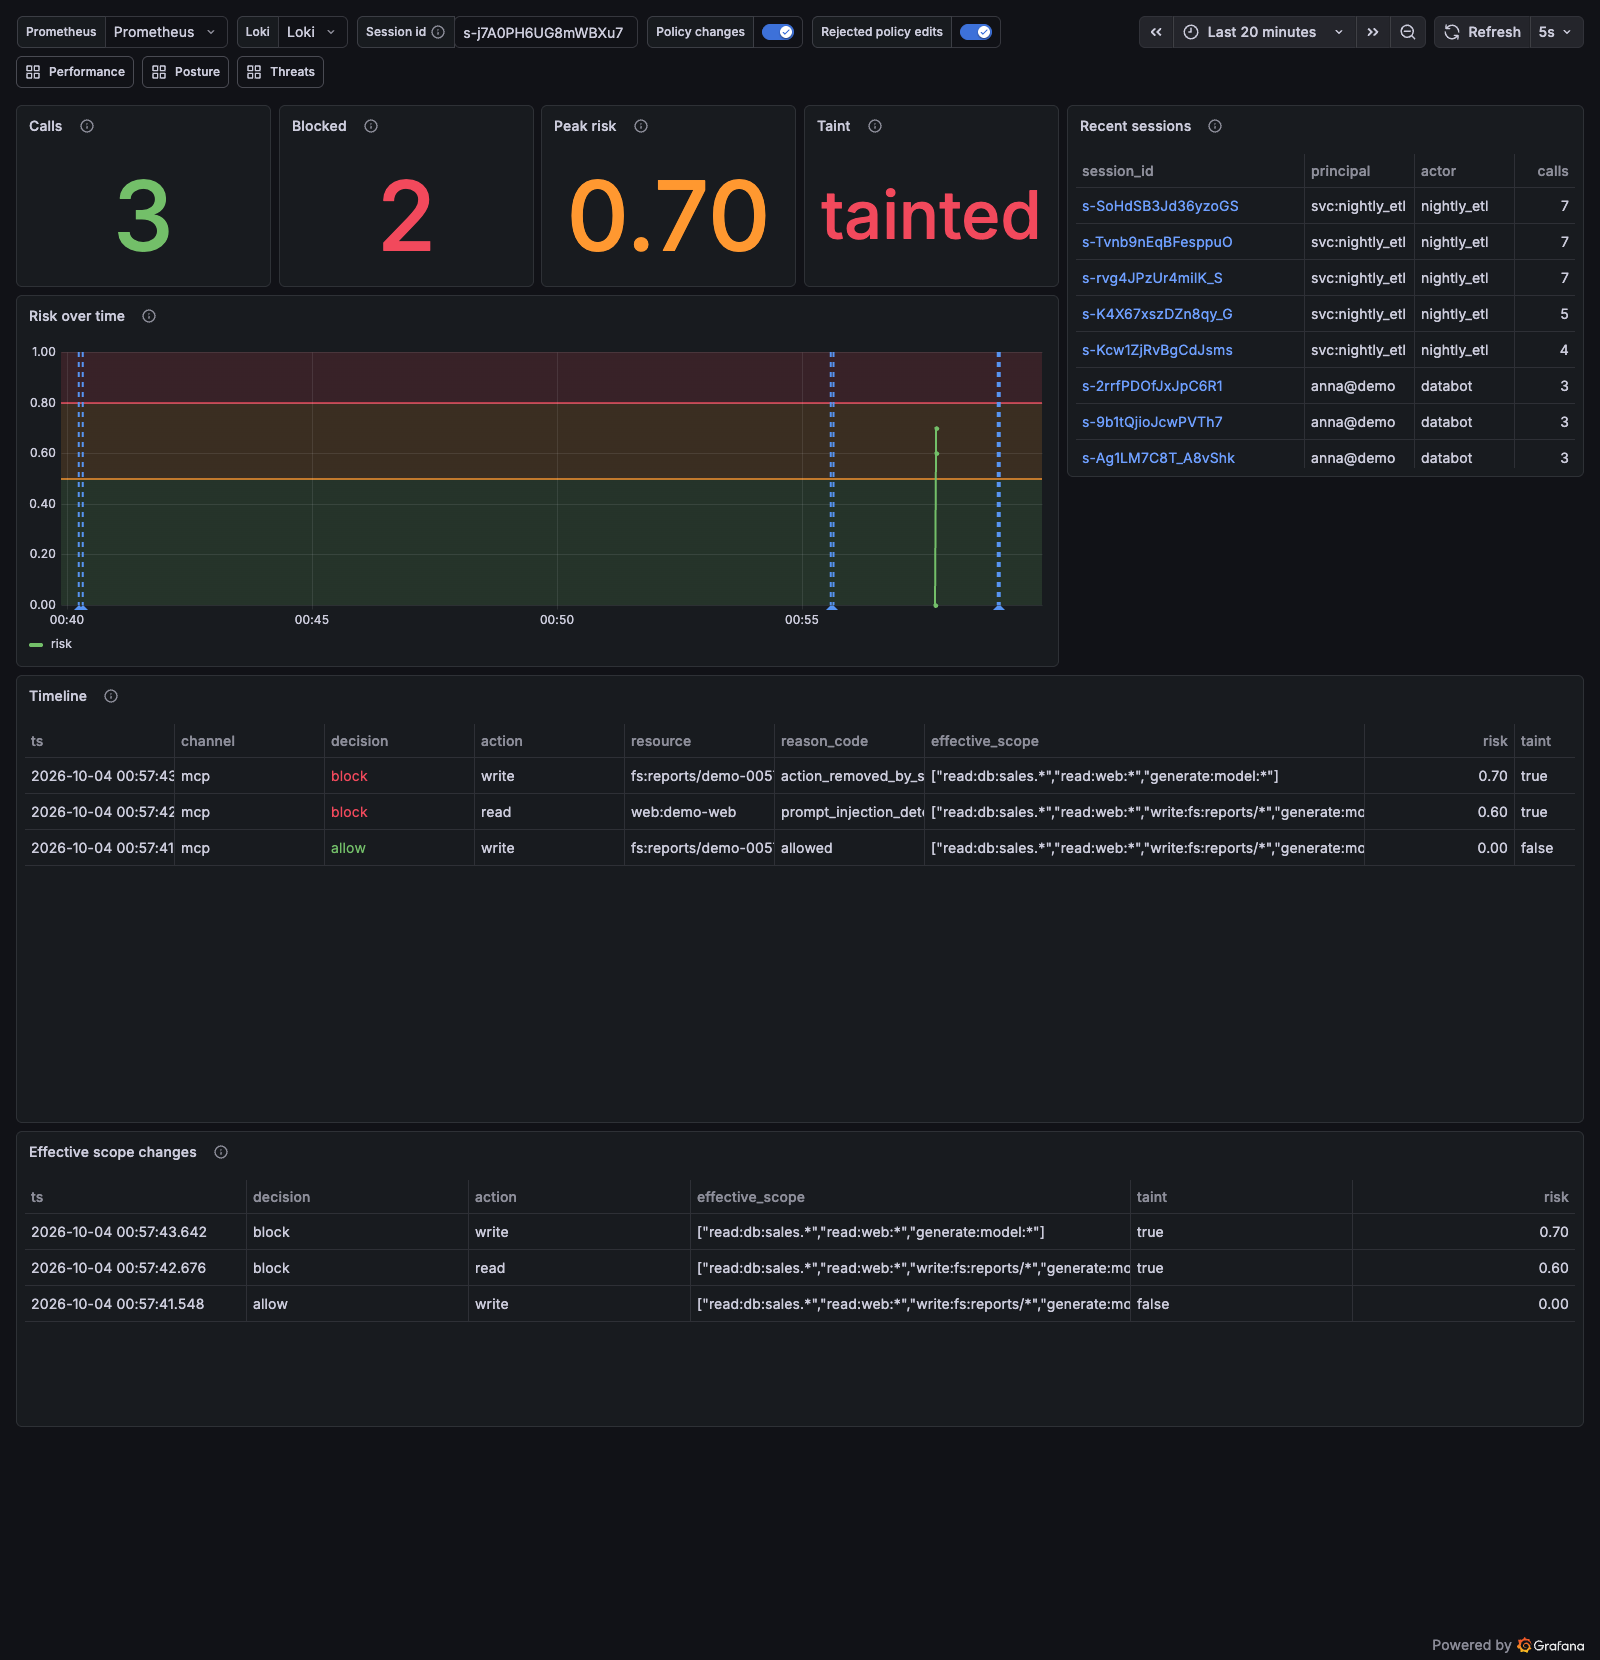
ALLOWED.web.fetchreturnsprompt_injection_detected, and its audit line showstaint=true risk=0.60. The second write getsaction_removed_by_session_risk, andwrite:fs:reports/*has dropped out of the effective scope. - Grafana: open the printed Session trace link for scene 2. Risk over time steps up, Taint
flips, and Effective scope changes shows
writeremoved. On Threats, the session shows up under Highest-risk sessions and Tainted sessions.
Scene 3: autonomous agent, held for approval, not stopped (about 20 s)
Say: "The same page reaches nightly_etl, which runs at night with no human to ask.
Removing its rights would break the job, so its write waits for an approver instead. Olga
approves it, and that exact call runs once. A replay of the approval is refused. While risk is
high, the agent is throttled with exponential backoff: it slows down instead of failing."
Audience sees:
- Terminal: the write gets
approval_requiredwith anapproval_id. Olga (an operator token with theops-teamapprover role) lists it withGET /admin/approvals. The listing shows tool, resource and reason, plus an argument digest, never the arguments. She approves it, and the agent retries with_meta["ai-control-layer/approval_id"], which isALLOWED. The replay getsapproval_already_used, and the approval's final state issucceeded. The next call is throttled first (waited 5.5, 10.5 s on Retry-After) and then allowed. - Grafana Threats: Approvals pending goes up and back down, and Approvals: requested and outcomes and Throttled calls increase.
The same approval works from the CLI: uv run acl approvals list and
uv run acl approvals approve <id>.
Scene 4: a query too expensive to run (1 to 3 s)
Say: "DataBot writes a triple cross join. sql_guard asks the planner what it would cost,
with EXPLAIN and never ANALYZE, and refuses it before Postgres does any work."
Audience sees:
- Terminal:
sql_cost_exceeded. The operator then runs the sameEXPLAINthat sql_guard runs (roleacl_app,acl.set_principal('anna@demo')), and it reports planner cost 70,495.2 againstmax_cost10,000. The agent itself never sees the cost. - Grafana Threats:
sql_guardappears in Top controls by block verdicts.
Scene 5: PII redacted before the model, secrets never sent (40 to 145 s)
Say: "This prompt contains a PESEL. The gateway masks it before the model sees it, so the model can only work with the mask. The second prompt contains an API key. It's refused in milliseconds, and the model is never called."
Audience sees:
- Terminal: the model answers
CALLER PESEL [REDACTED:PL_PESEL], INVOICE RESEND.It was asked to upper-case the line, and the line it received already held the mask. The audit line showspii/pre=pii_detectedwith decisionredact. The API-key prompt getssecret_detectedin about 0.1 s, and its audit line has no upstream latency. - Grafana Posture/Threats: the
secretsblock appears.
This is the slow scene. One CPU turn (about 15 to 40 s) is followed by the output_policy
judge (about 10 to 25 s). Use the wait to explain the judges.
The scene checks four things. The prompt's pii verdict is redact. The model was called,
which proves it got the redacted prompt. The PESEL digits are absent from anything that came
back. And the answer was either released or withheld with judge_unavailable. A busy CPU can
push the output_policy judge past its deadline; the judge then fails closed and withholds
the answer. That outcome belongs to the judge, not to the redaction, so the transcript says
so and the scene still passes. The answer is shown whenever it is released.
Scene 6: no way around the gateway (4 to 8 s)
Say: "Suppose the agent is compromised and tries to go around the gateway. From inside its container, the gateway answers and nothing else does. Ollama, Postgres and the MCP servers don't resolve by name and aren't reachable by IP. There's no internet either."
Audience sees:
- Terminal:
gateway:8080 CONNECTED, which is the positive control. Every other target ends inno connection, either because the name doesn't resolve or because the network is unreachable. The IPs are each container's real addresses, read withdocker inspecton the host.
tests/bypass/ checks the same thing exhaustively, for every network and from mcp-fetch too.
Scene 7: change the policy live (3 to 6 s)
Say: "Now a judge changes the rules. We raise max_cost in config/policy.yaml. The
gateway reloads without a restart. Scene 4's query now runs, and its audit entry carries the
new policy revision. Then we put the file back."
Audience sees:
- Terminal: the revision changes, say
f83f261412c7 -> f4e8ebf64543, together with thepolicy_reloadaudit event that feeds Grafana's annotation. The same heavy query isALLOWEDand counts 19,200,000 rows. The audit line showsrev=<new>. After the restore, the revision is back to the original. - Grafana Threats: two policy-change annotations, one for the edit and one for the restore.
The orchestrator writes the edited file atomically (a temporary file in config/, then
os.replace) and always restores the original bytes, even when the scene fails. The original
is also kept in reports/.demo-policy-backup.yaml until the restore has landed, and the next
run restores it if a run was killed half-way. config/ is mounted as a directory, so the
gateway's watcher sees the replaced file. If the watcher hasn't reacted after 8 s, the
orchestrator calls POST /admin/reload.
Why the injection page is served locally
Scenes 2 and 3 need a web page with a hidden instruction, fetched through the web tool. That
page lives in demo/web/q3-market-notes.html. The
injection is a display:none block, worded so that only the injection classifier catches it,
not a feed signature. If a signature also fired, risk would cross 0.8 and freeze tools
(tools_frozen) instead of showing the taint rule.
The default stack refuses to fetch such a page from inside the stack, by design. Both the
gateway's egress control and mcp-fetch reject any destination that isn't a public address,
and every container has a private one. That is the SSRF defence. The options were:
| Option | Why not, or why |
|---|---|
| Host the page on the internet | The demo would depend on a site that can change, vanish or be blocked at a venue, and it would publish attack text. |
| Use a public page with injection-like text | Same dependency. A false positive (the example.com page scores 0.94) isn't a hidden injection, and claiming it is would mislead. |
Give demo-web a "public" IP on a Docker network |
It would lie to our own SSRF check. |
| A demo overlay with one exception bound to a name, an address and an origin (chosen) | It is off by default, explicit, refuses any other answer, and is visible in every audit entry. |
The overlay demo/compose.demo.yml is applied only when it's named
on the command line (make demo-up). It adds three things:
demo-web, a staticpython -m http.serverwithnobodyas its user, a read-only root filesystem,cap_drop: ALL,no-new-privilegesanddemo/web/mounted read-only. It sits alone on the internaldemo_webnetwork with mcp-fetch, at the static address10.218.97.10(subnet10.218.97.0/28, outside Docker's default address pools and the stack's own networks). The agent, the gateway and the other upstreams share no network with it, so it models "a site on the internet" reachable only through the fetch server.- mcp-fetch joins
demo_weband getsACL_FETCH_DEMO_HOSTS=demo-web=10.218.97.10. - The gateway gets the same binding:
ACL_EGRESS_DEMO_HOSTS=["demo-web=10.218.97.10"].
Each binding ties together a name, an address and an origin. A fetch is exempt from the public-address rule only when all four of these hold:
- the scheme is
httpand the port is 80; - the host is exactly
demo-web, never an IP literal and neverdemo-web.<anything>; - every DNS answer for the name is exactly
10.218.97.10; - mcp-fetch pins its connection to that validated address, as it does for every fetch.
The binding exists because of a review finding against the first version, which exempted the
name alone. That version trusted whatever demo-web resolved to. A conflicting alias on another
network the fetcher joins, a poisoned answer or an /etc/hosts override could then point
http://demo-web/ at 127.0.0.1, 169.254.169.254 or another internal service, and both
layers would accept it. Now any other answer falls back to the normal rule and is refused,
and so do https and port 443.
The two layers differ in one respect. The gateway shares no network with demo-web, so in
compose the name has no answer there. The gateway therefore checks that no answer contradicts
the binding, and it audits each use as egress_demo_host. mcp-fetch is the one that connects,
so it requires the answer to be exactly the bound address before it opens the connection.
Both switches are needed. Each defaults to empty, a malformed or unbound entry (for example a
bare demo-web) stops the service at startup, and the unit tests pin all of this. Without the
overlay, http://demo-web/ is egress_private_address at the gateway and
DisallowedDestinationError at mcp-fetch. With it, an injected resolver answering 127.0.0.1,
169.254.169.254 or a different private address is refused at both layers, and https or
:443 is refused too. See tests/unit/test_egress_demo_hosts.py and
demo/mcp_servers/tests/test_fetch_server.py.
Nothing else changes. The page goes through the untrusted server like any web page: its
result taints the session, and the classifier reads hidden elements because it keeps them on
purpose.
Resetting between runs
Nothing needs resetting. Each scene mints new tokens, so it gets new sessions, budgets and
taint, and report file names carry the run's time (demo-<HHMMSS>-*.md). Approvals expire on
their own. Two things persist on purpose:
- The
reportsvolume collects the demo's report files. Remove them withdocker compose exec mcp-files sh -c 'rm -f /data/reports/demo-*.md'if you want a clean listing. - The throttle window is per agent and lasts about 10 s, so wait a few seconds before re-running scene 3 on its own.
To return to the default stack (no demo-web, no demo allowances): make demo-off.
If the LLM is slow
On CPU, qwen3:8b produces about 2.4 tokens/s, and the machine's other load matters. A busy
host has stretched one turn to 40 s and pushed the output_policy judge past its 40 s deadline.
The judge then fails closed and the gateway answers judge_unavailable.
- Scene 5 retries once with a new session when the first attempt ends in
judge_unavailable, and says so in the transcript. If the retry is withheld too, the transcript explains it and the redaction checks still decide the scene. Scene 5 is the only LLM scene. - Warm the model first (see Prerequisites), and close heavy local workloads before presenting.
- If it is still too slow, run
make demo DEMO_ARGS="--scene 1 --scene 2 --scene 3 --scene 4
  --scene 6 --scene 7"
and show scene 5 from the recording (docs/demo.cast). The secret-blocking half of scene 5 never waits for the model. - Every agent request sends
reasoning_effort: "none"and a smallmax_tokens(40). Without them qwen3 thinks for minutes.
Recorded run
demo.cast is an asciinema recording of a full make demo (play it with
asciinema play docs/demo.cast). Playback shortens pauses longer than 5 s. The recording was
made on a laptop under other load, with qwen3:8b on CPU in Docker.
demo-transcript.txt is the same run as plain text. Its summary:
| Scene | Seconds | Checks |
|---|---|---|
| 1. Same agent, same question, different person | 2.6 | 3/3 |
| 2. Indirect injection taints an interactive session | 3.6 | 4/4 |
| 3. Autonomous agent: held for approval, not stopped | 20.8 | 7/7 |
| 4. A query too expensive to run | 1.1 | 2/2 |
| 5. PII redacted before the model, secrets never sent | 49.0 | 6/6 |
| 6. No way around the gateway | 4.1 | 8/8 |
| 7. Change the policy live, same request, new verdict | 2.9 | 3/3 |
| Total | 84.1 | 33/33 |
Scene 3's 20 s is mostly the throttle backoff: the agent waited 5.5 s and then 10.5 s on
Retry-After. Scene 5's time is the CPU model and its judge. Earlier runs on the same machine
took 2.5 to 10 s for scene 1 (the first docker compose exec is slower). Scene 5 took up to
145 s when both attempts waited out the 40 s judge deadline.
Screenshots taken after the run:
| Threats | Session trace (scene 2, tainted) |
|---|---|
 |
 |