Security reporting
Management sees posture, cost and trends; security teams get per-session decision traces and an exportable audit trail. Everything below runs locally next to the gateway.
make up also starts Prometheus, Loki, Grafana Alloy and Grafana, all on the ops network
only. Grafana is published on http://127.0.0.1:3300 (ACL_GRAFANA_HOST_PORT); log in as
admin with ACL_GRAFANA_ADMIN_PASSWORD from .env. Anonymous access and sign-up are off.
- Metrics. Prometheus scrapes the operator listener's
/metricsevery 5 s (7 days kept). - Audit log. The gateway writes one JSON line per decision to append-only segments
/var/log/acl/audit-<UTC time>-<n>.jsonlon theaudit_logvolume (ACL_AUDIT_PATHnames the base,/var/log/acl/audit.jsonl). It starts a new segment every 50 MiB and keeps 4 old ones (ACL_AUDIT_MAX_BYTES,ACL_AUDIT_BACKUPS). A segment is never renamed, so Alloy, which keys its read offset by path, resumes correctly after an outage of any length within that retention. Alloy mounts the volume read-only, with no Docker socket, and pushes the lines to Loki (7 days kept). Onlychannel,decision,actor,modeandeventbecome Loki labels. Session ids, principals, resources and reason codes stay in the line; query them with| json. - Policy changes. Every reload attempt also writes a line,
{"event": "policy_reload", "result": "ok|unchanged|invalid", "revision", "previous_revision"}. The dashboards drawokreloads as blue annotations and rejected edits as red ones.
| Dashboard | For | Panels |
|---|---|---|
| Posture | management | Decisions, block rate, held calls, spend, tokens, top threat reason codes, cost per user and agent, budget usage, daily trend |
| Threats | security | Live block stream, highest-risk sessions (click through to the trace), top controls by block verdicts, signature hits, approvals, tainted sessions, killed agents, throttles |
| Session trace | security | $session_id: every decision with its effective scope, risk and taint, plus risk over time; Recent sessions lists the ids |
| Performance | judges, ops | Overhead p50/p95/p99 per channel, control latency p95, throughput, upstream and judge latency |
| Recording | demo video | One full-width column for a ~760×1000 browser slot: session risk gauge, compromised yes/no, risk over time (policy-change markers), the last six decisions, blocked in 5 min, approvals waiting, requests and redactions, and the per-call p95 of rule checks and of AI checks (live) |
The dashboards are generated from grafana/build_dashboards.py and committed (make
dashboards after editing it; a test fails when the JSON is stale). make smoke sends demo
traffic: RLS counts, a table refusal, taint and the refused write, sql_guard, PII, secrets,
a signature hit, loop detection, an approval, the kill switch and a policy reload. With
SMOKE_ARGS="--bump-policy config/policy.yaml" it edits max_cost, reloads, restores the file and
reloads again. uv run python -m observability.verify_panels runs every panel query against
the live stack, both directly against Prometheus/Loki and through Grafana.
Two panels stay empty until Ollama has a model (ollama-init): tokens and LLM judge latency.
A fresh stack's Daily trend fills in over the hours that follow.
Screenshots after make smoke on a fresh stack (no Ollama model pulled):
| Posture | Threats |
|---|---|
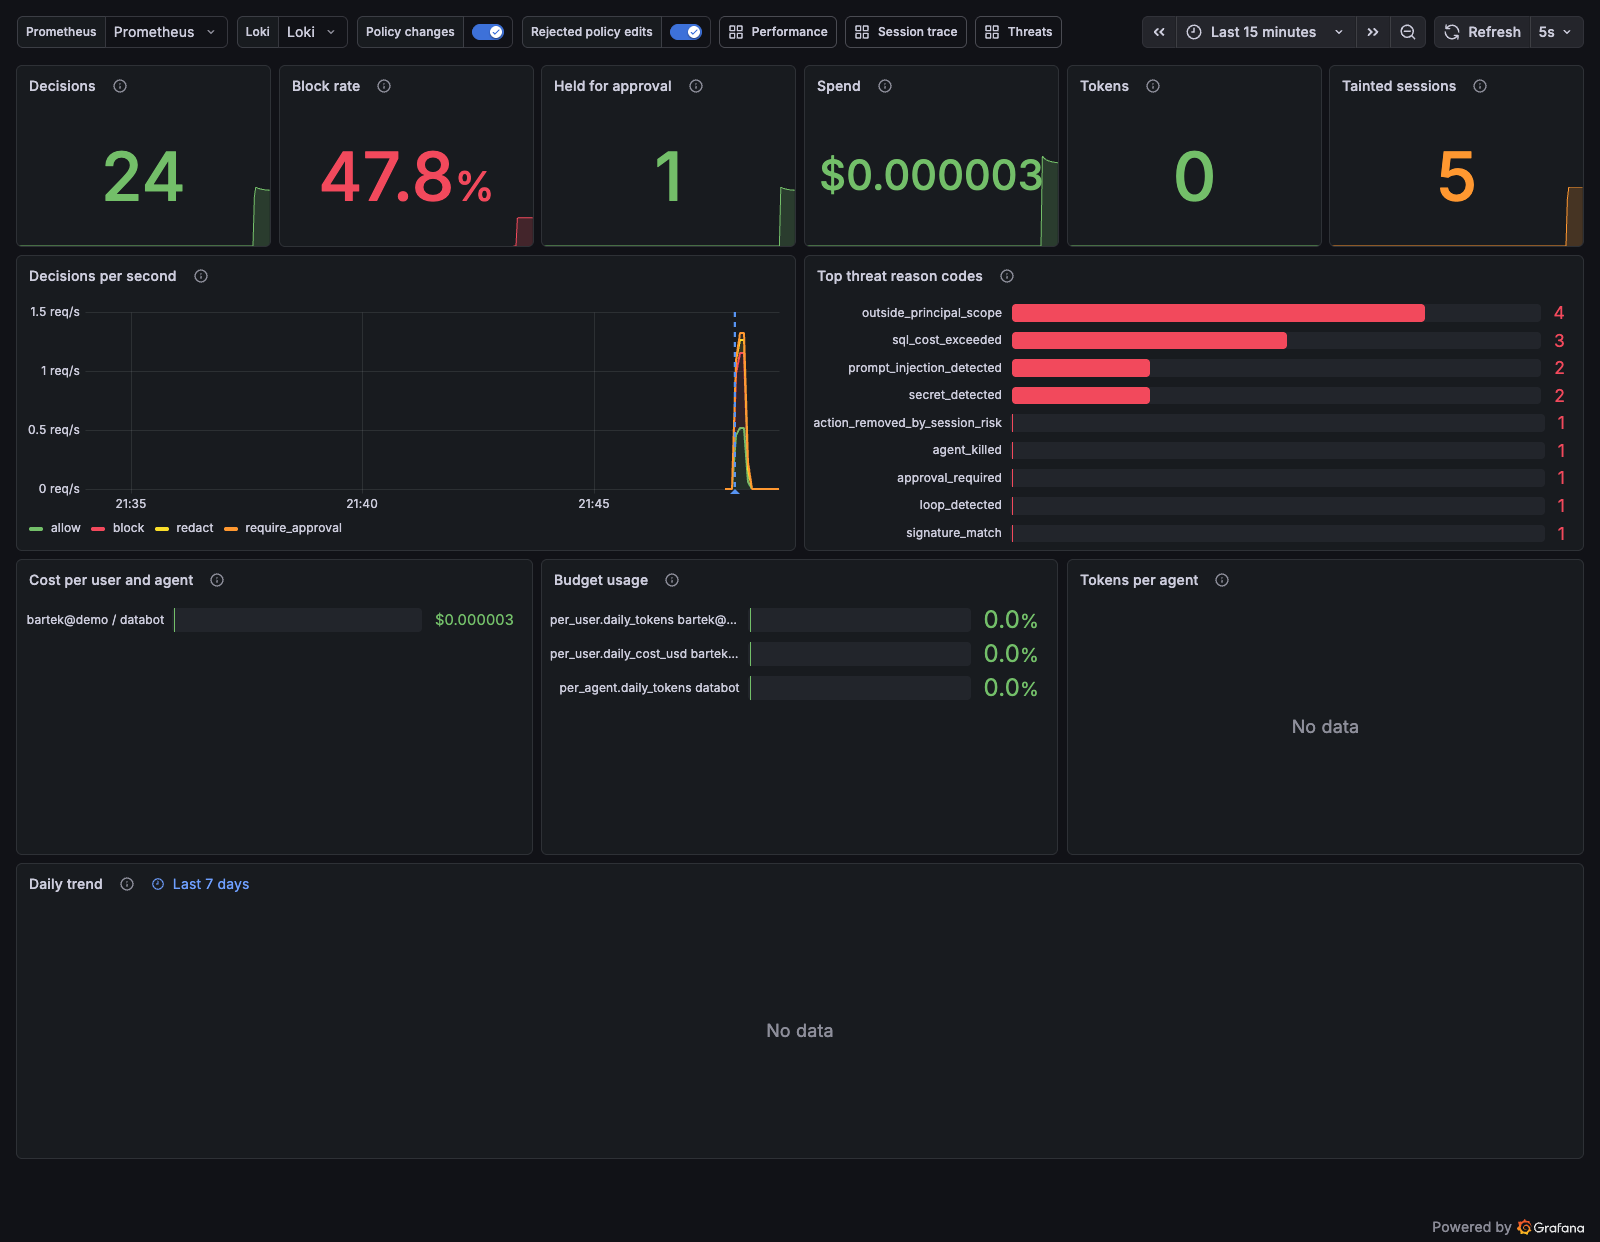 |
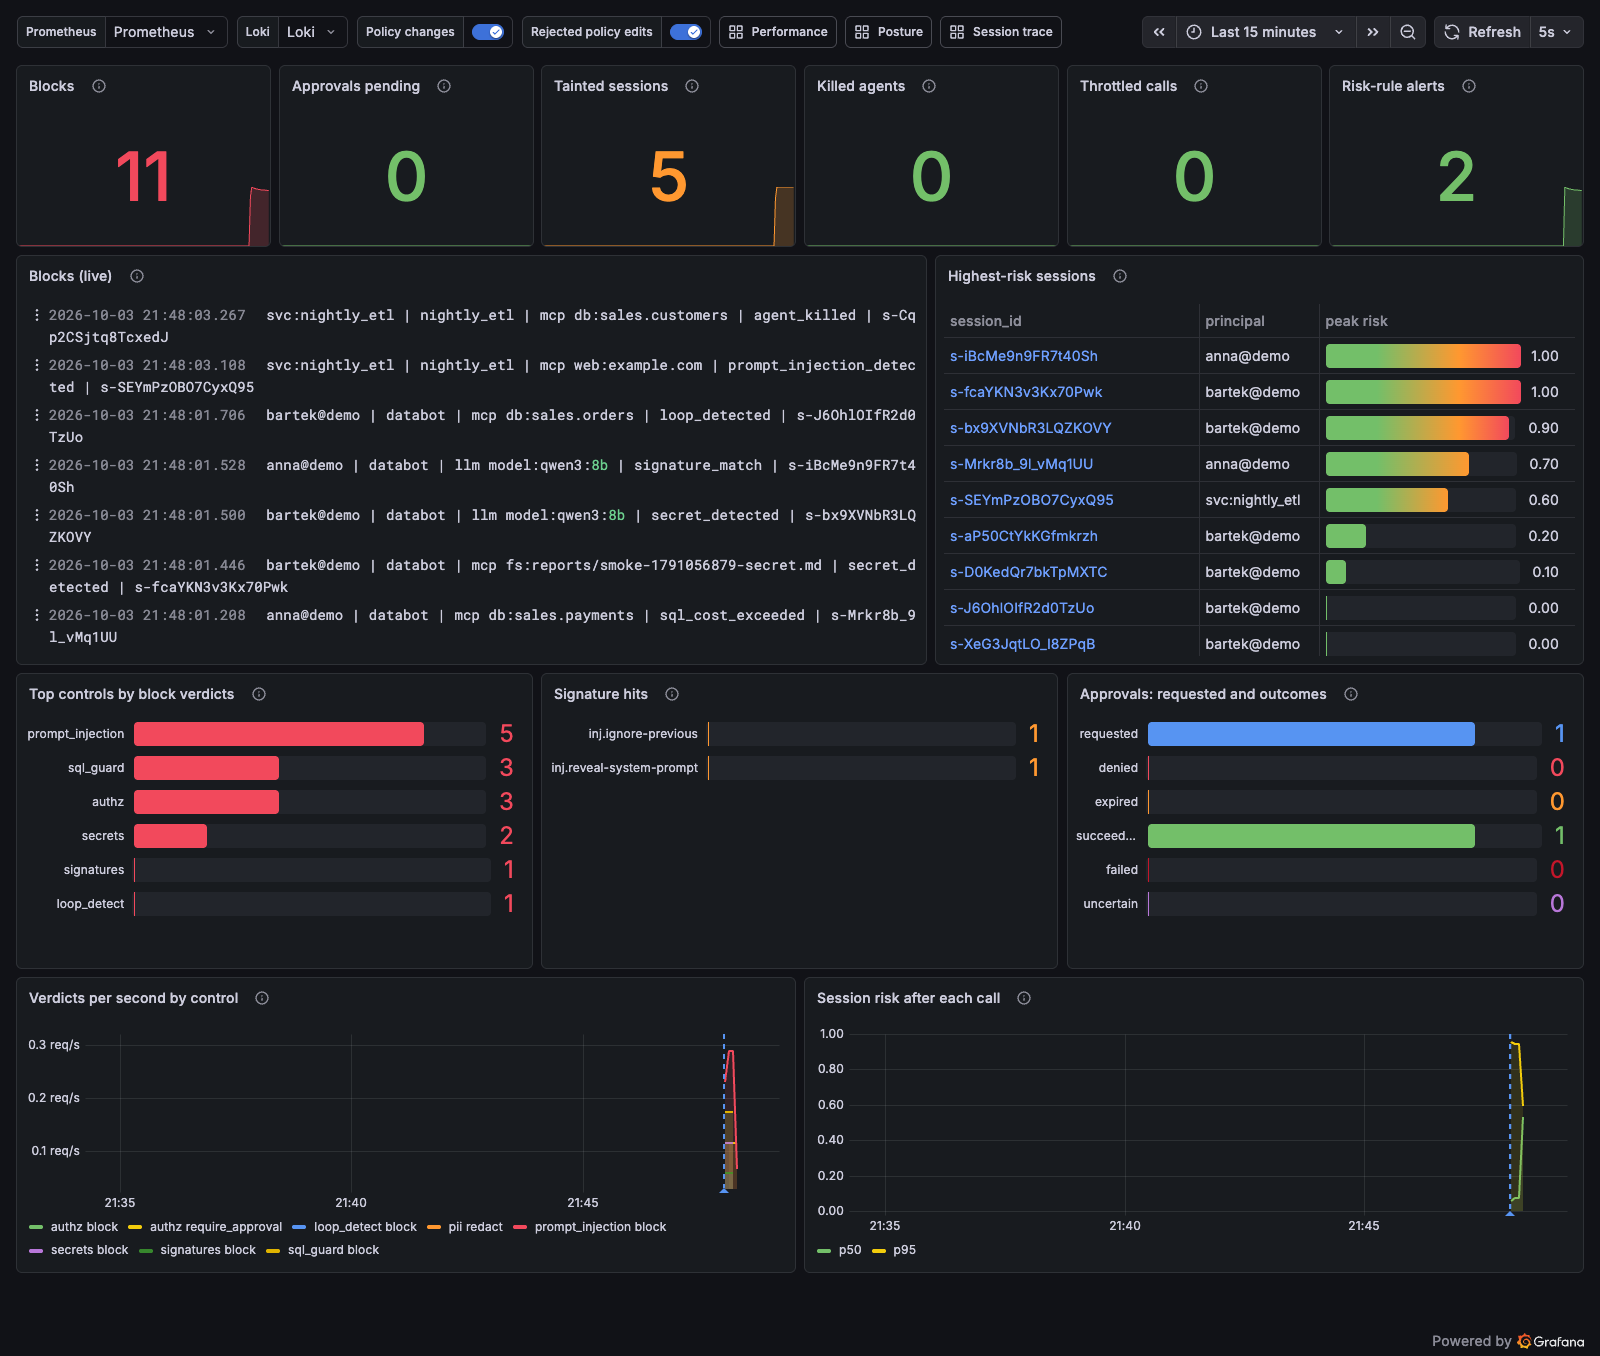 |
| Session trace | Performance |
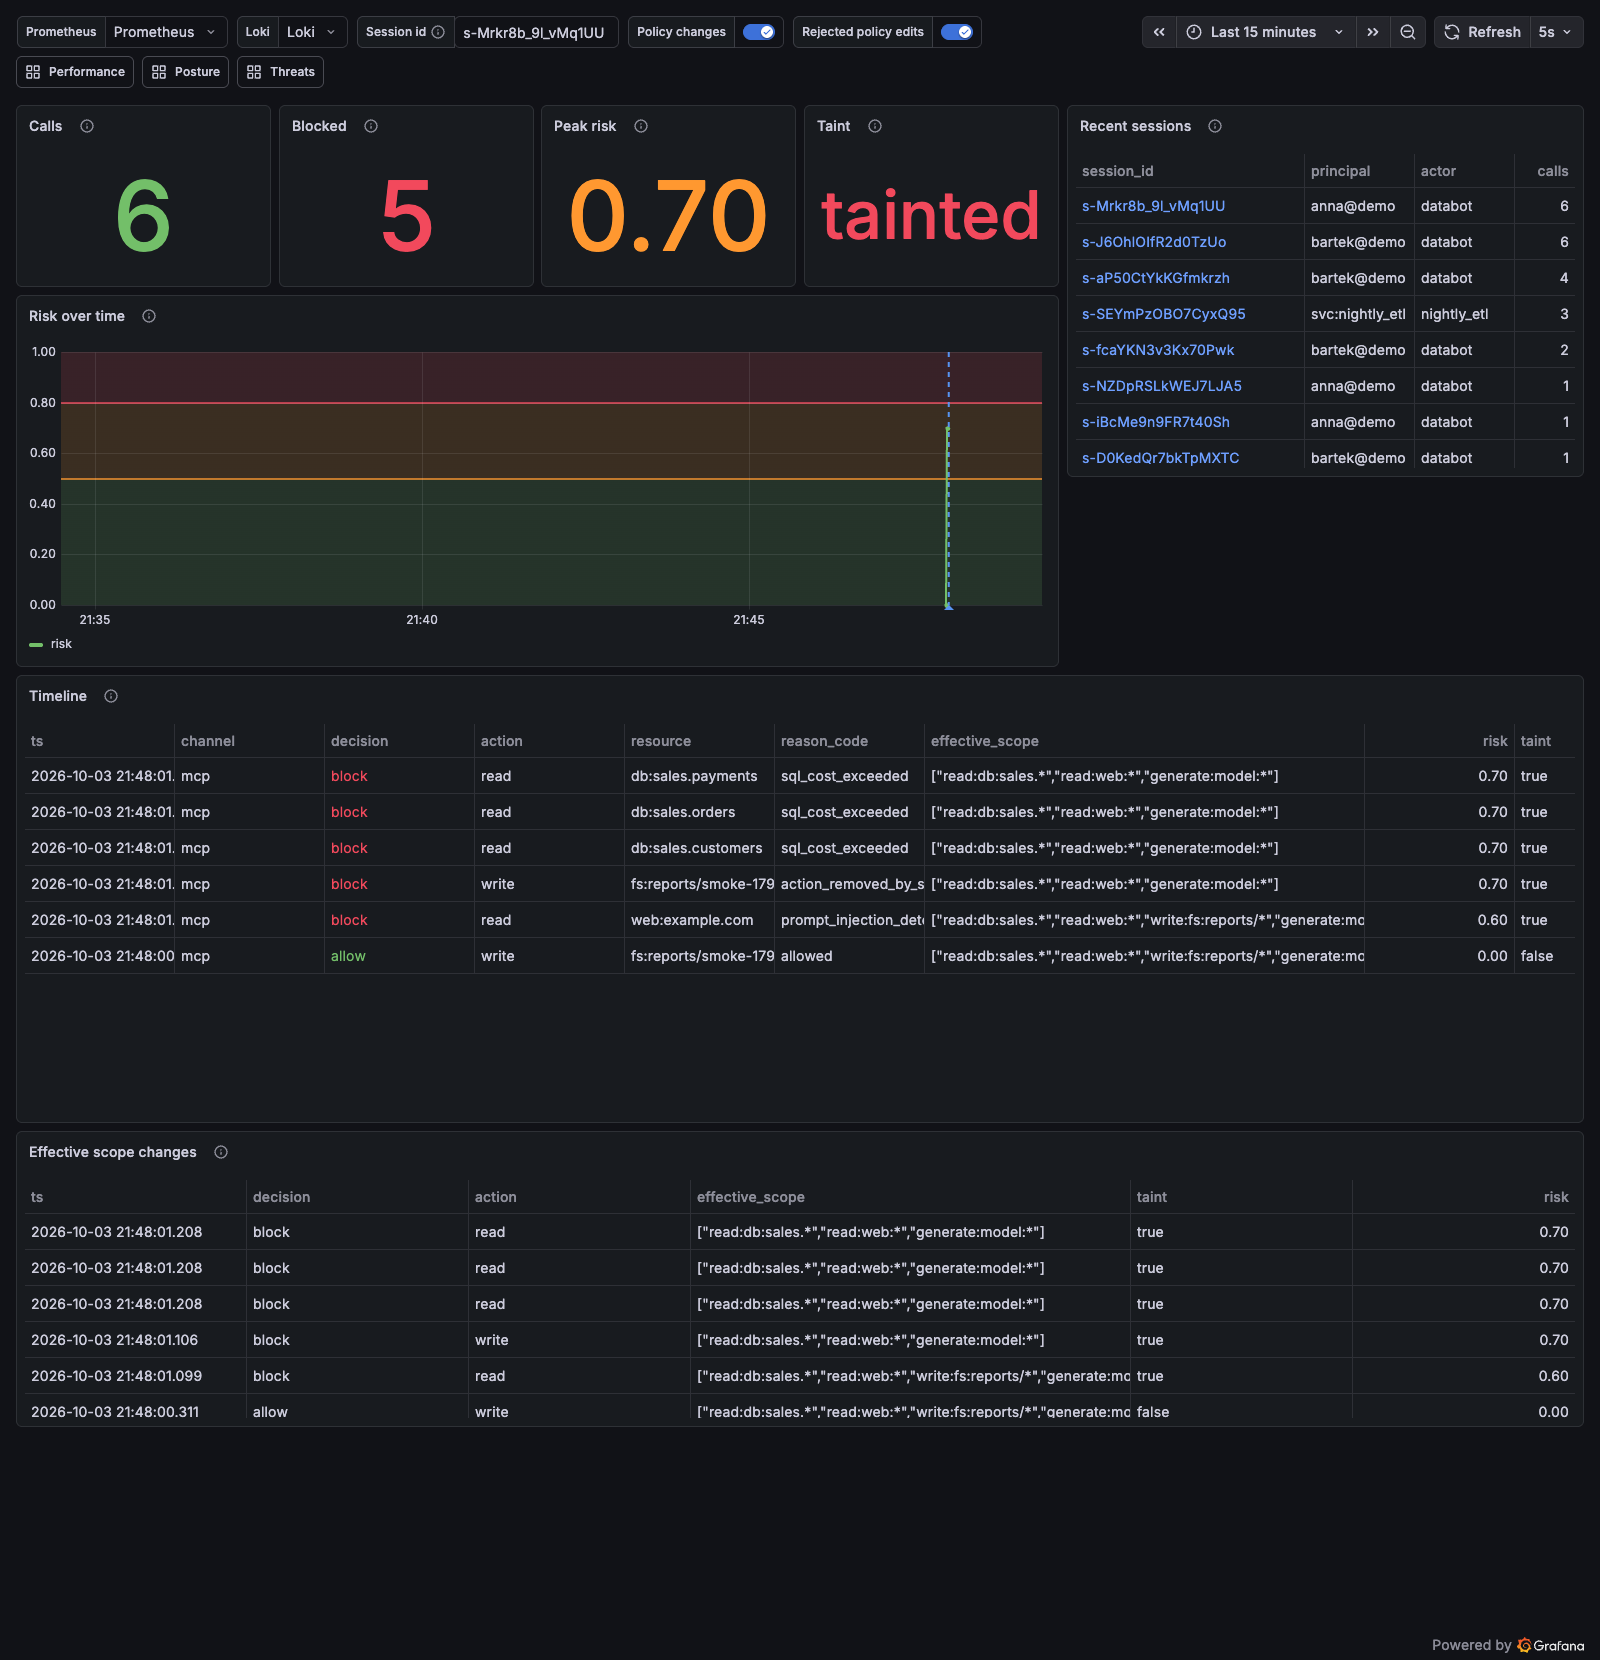 |
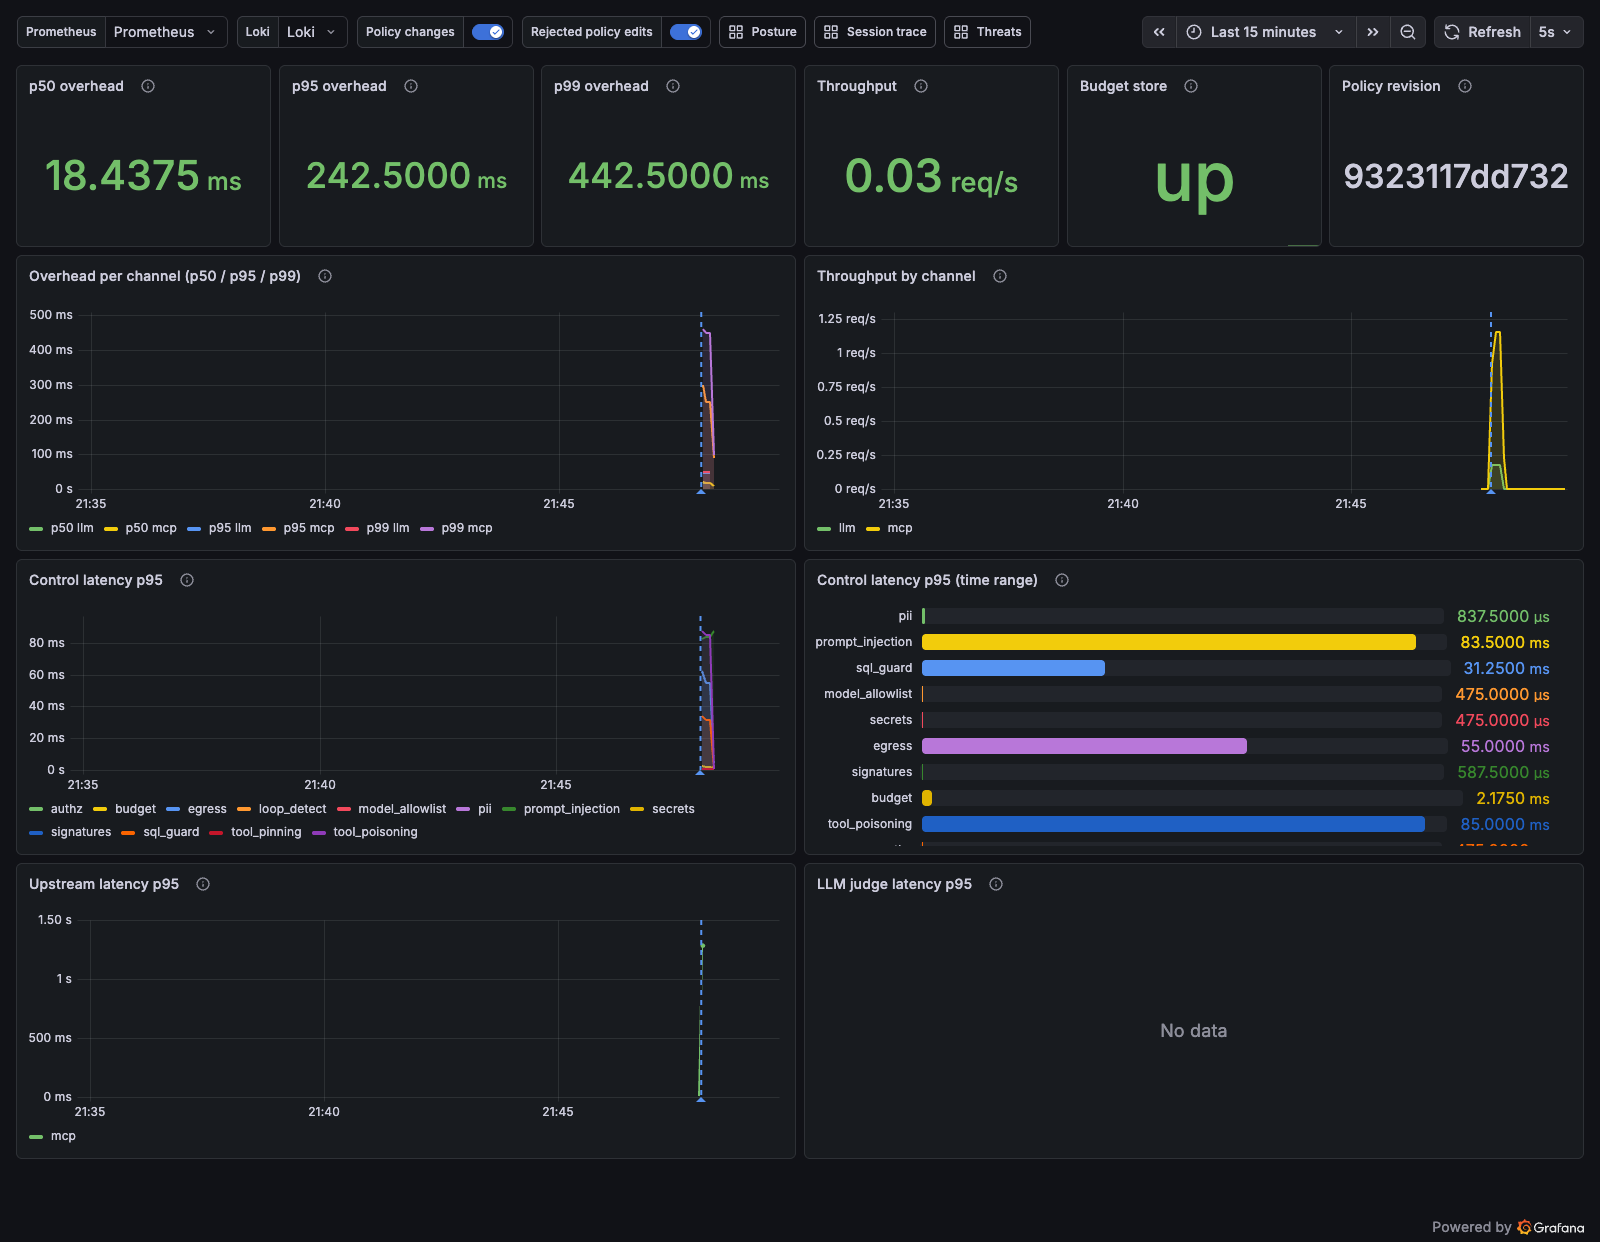 |
The Recording dashboard is for the demo video (Grafana in 40 % of a 1920×1080 screen). Open it
in kiosk mode, optionally focused on one session; empty var-session_id follows every session:
http://127.0.0.1:3300/d/acl-recording/recording?orgId=1&kiosk&theme=dark&from=now-5m&to=now&refresh=5s&_dash.hideTimePicker&_dash.hideVariables&_dash.hideLinks&var-session_id=<session id>
